


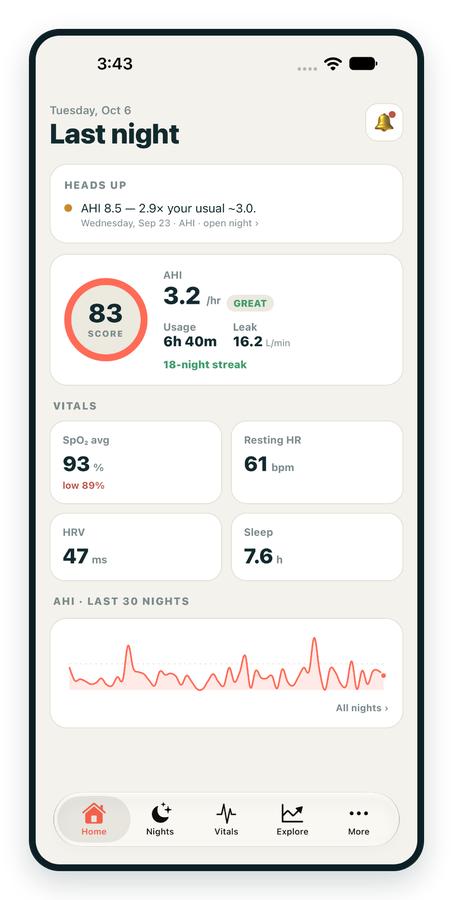
iPhone / iPhone Duo Live
Last night before you are out of bed. Apple Health vitals, Face ID.
Download on the App Store Apnealytics
Free on every plan: unlimited imports, the full dashboard and your last 30 nights.
 Compatibility checkerWill my machine work?Type your model. You get a straight answer: supported, partial, waitlist, or why not.Check my machine
 If it writes an SD card, we probably read it. ResMed AirMini has no card, so no app can read it.
Sleep Check-up
3 of 6 checks done
Six short screeners, one picture of how you sleep. Earn a milestone for each, save results and get retake reminders.
Latest milestone: Sleepiness check done
 NEWTrack your 90-day compliance windowOpen the calculator
 13 free tools. No account needed — sign in to save results and fill answers from your own CPAP data.
Last night before you are out of bed. Apple Health vitals, Face ID.
Download on the App Store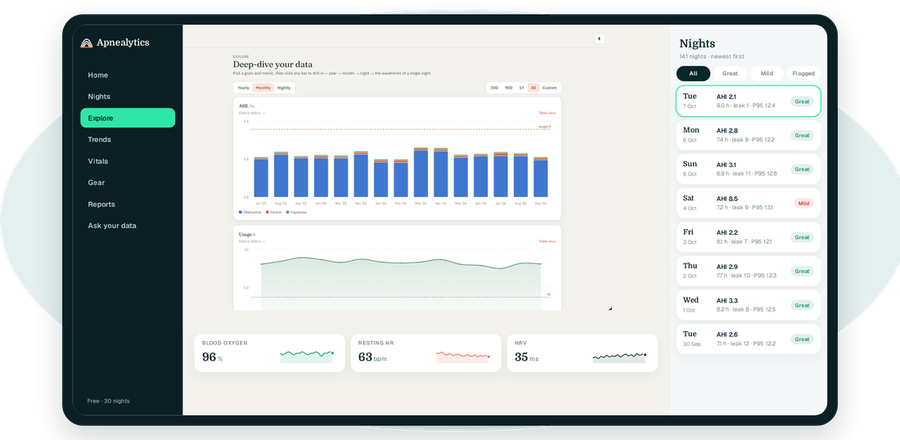
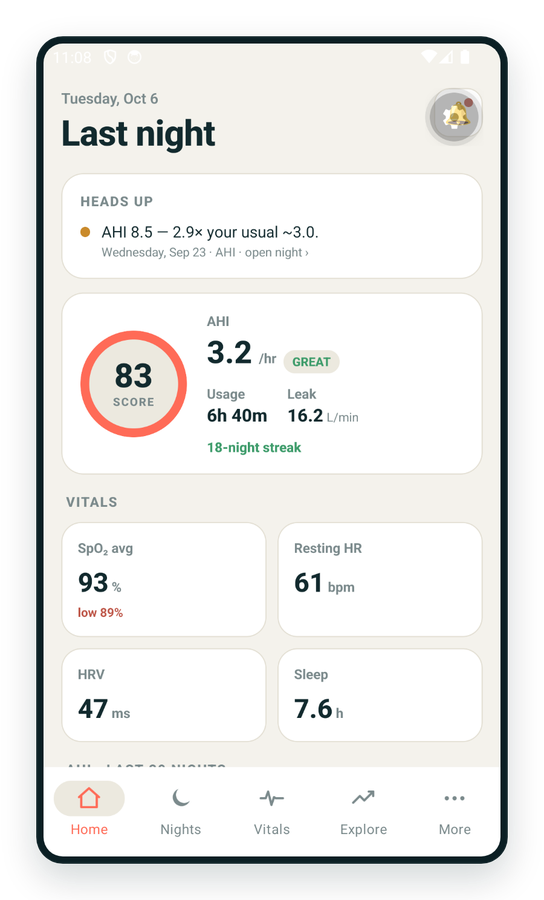
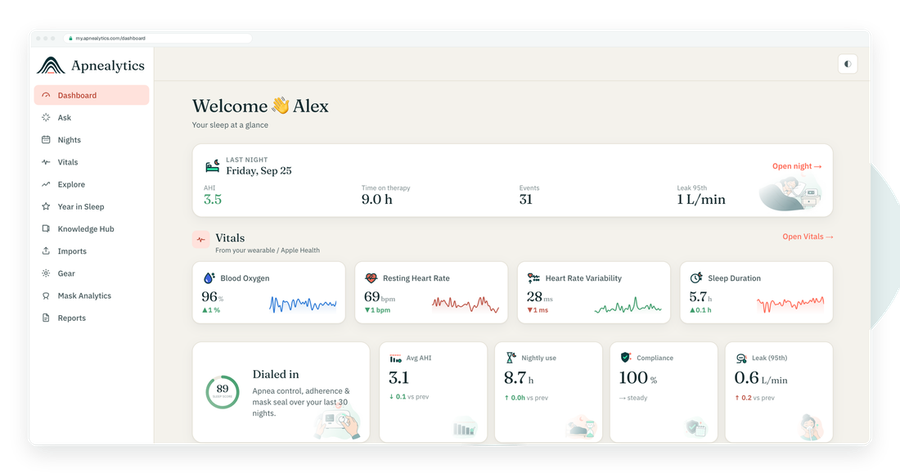
One account on every screen. Apple Watch vitals sync through Apple Health.
AHI stands for apnea-hypopnea index. It is the number of apneas and hypopneas you have per hour, and it is the single most-quoted number in sleep apnea care. In a sleep lab it is measured per hour of sleep. On your CPAP machine it is estimated per hour the mask was on.
Two kinds of breathing event go into the index.
An apnea is a near-complete stop in airflow. The American Academy of Sleep Medicine (AASM) scores an apnea when airflow drops by 90 percent or more from baseline for at least 10 seconds.
A hypopnea is a partial reduction. The AASM's recommended rule scores a hypopnea when airflow drops by at least 30 percent for at least 10 seconds and that drop is accompanied by either a 3 percent fall in blood oxygen or an arousal from sleep. An older, still-used alternative rule requires a 4 percent desaturation and does not count arousals. See hypopnea explained for why that difference matters.
Add the apneas and hypopneas together, divide by hours, and you have AHI. An AHI of 4.2 means roughly four events every hour across the night.
For adults, the widely used bands are:
| AHI (events/hour) | Category |
|---|---|
| Under 5 | Normal |
| 5 to 15 | Mild sleep apnea |
| 15 to 30 | Moderate sleep apnea |
| Over 30 | Severe sleep apnea |
These bands come from a diagnostic sleep study, not from a CPAP machine. They describe how often you stop breathing without treatment. Once you are on therapy, the number you see each morning is your residual AHI: what is left after the machine has done its work. The target for treated apnea is usually a residual AHI under 5, and many people run well below that. What is a good AHI on CPAP? goes into this in more detail.
In polysomnography you are wired for brain activity (EEG), eye movement, muscle tone, airflow at the nose and mouth, chest and abdominal effort belts, and pulse oximetry. A technologist scores each event by hand, or checks automated scoring, against the AASM rules. Because the lab can see when you are asleep, the denominator is true sleep time. Because it can see oxygen and arousals, it can apply the full hypopnea rule.
A home sleep apnea test records fewer channels, usually airflow, effort, oximetry and position. It cannot see sleep stages, so it reports events per hour of recording, which tends to run a little lower than a lab AHI because some of that recording time is spent awake.
Your machine has one sensor that matters here: a flow sensor in the blower. It sees the air moving through the tube. From that single signal it has to infer whether you are breathing normally, partially, or not at all, and whether a pause was obstructive or central.
That means three important differences from a lab number.
The denominator is usage, not sleep. The machine counts events per hour the mask was on and the blower was running. If you lie awake for an hour reading with the mask on, that hour is in the denominator with few events in it, which lowers the AHI.
There is no oxygen and no EEG. The machine cannot see a desaturation or an arousal, so it cannot apply the AASM hypopnea rule as written. Manufacturers use flow-only definitions instead. ResMed, for example, scores a hypopnea on a sustained reduction in airflow alone. A hypopnea on your machine and a hypopnea in a lab are therefore related but not identical events.
Wake breathing can look like events. Sighs, swallows, talking and shifting position can produce flow patterns the algorithm flags. Most of these are brief and get filtered, but some will be counted.
Studies comparing machine-estimated AHI with simultaneous polysomnography generally find good agreement when leak is low, with the machine tending to under- or over-count in specific situations such as high leak or a high proportion of central events. The practical reading is simple: a machine AHI is a reliable trend indicator and a reasonable estimate, not a diagnosis.
If a machine AHI is an estimate, why look at it? Because it is measured every single night, in your own bed, for as long as you use therapy. A sleep study gives you one night in a strange room. Your machine gives you thousands of nights. Trends over weeks and months, and changes after a settings or mask change, are exactly what the machine number is good at.
It is also the number your clinician sees when they pull your data, so understanding it puts you on the same page.
A few things reliably move the number on CPAP.
On your dashboard, last-night AHI appears as a headline tile with a colour band: Great, Mild, Moderate or High. Below it, the event composition ring breaks the night into obstructive, central, hypopnea and unclassified so you can see what kind of events made up the number, not just how many.
The 30-night rolling AHI trend sits beside it, and the Heads up panel flags an unusual night in plain words, for example "AHI 8.5 — 2.9× your usual ~3.0". That comparison to your own baseline is often more useful than the absolute number.
In Trends you can stretch the view to 90 nights, a year or all time, compare one period against another, and overlay leak, pressure and usage to see what moved together. Pro users can open any night in the breath-by-breath viewer and see the flagged events on the airflow trace itself.
All of this is read from the SD card of a ResMed AirSense, AirCurve or S9 machine through the web SD card import.
Bring the trend, not a single night. One bad night is weather; four bad weeks is climate.
AHI stands for apnea-hypopnea index. It is the number of apneas (near-complete pauses in airflow of at least 10 seconds) plus hypopneas (partial reductions in airflow) per hour. A sleep lab measures it per hour of sleep; a CPAP machine estimates it per hour of use. It is the standard way to describe how often breathing is disrupted during the night.
For adults, an AHI under 5 events per hour is considered normal. From 5 to 15 is mild sleep apnea, 15 to 30 is moderate, and over 30 is severe. These bands are used to classify untreated apnea at diagnosis. On CPAP, the goal is usually to bring the residual AHI below 5.
It is a reasonable estimate and a good trend indicator, not a diagnosis. The machine infers events from airflow alone, cannot see oxygen levels or sleep stages, and counts events per hour of use rather than per hour of sleep. Agreement with lab studies is generally good when leak is low and worse when leak is high.
This is uncommon but possible. High leak can make the machine miss or misclassify breathing, pressure may be lower than you need, or central events may have appeared on therapy. Illness, alcohol and back sleeping also raise events. Look at the trend over several weeks and talk to your clinician if it stays elevated.
Yes. AHI counts all apneas and hypopneas regardless of type. ResMed machines separately report obstructive apneas, central (clear airway) apneas, hypopneas and unclassified apneas, and Apnealytics shows that breakdown in the event composition ring. Knowing the mix matters, because obstructive and central events are managed differently. See central vs obstructive apnea on CPAP.
Upload your card and the dashboard shows last night against your usual. Free, forever.
 DashboardSleep Score, AHI band, leak and pressure
 Trends & historyA year down to a night
 Breath-by-breath viewerAirflow, pressure, leak tracesPro
 SpO₂ overlayOximeter data on the same nightPro
 Pressure insightsP95, set range, EPR and ramp
 SD card importDrop the card folder, only new nights added
 Mask fit & gearWhich mask actually seals
 Ask your dataPlain-English questions, your own AI keyBYOK
 Year in SleepYour therapy year in one storyNew
 Compliance reportFinds the qualifying window for youPro
 Share with your doctorRead-only, revocable links
 Companion appiPhone, iPad and Android
 Privacy & securityYour data, locked to you
 ResMed AirSense 10 & 11Supported
 ResMed AirCurve 10 & 11 VAutoSupported
 ResMed S9 / LumisSupported
 Philips DreamStation 1 & 2Supported
 Fisher & Paykel SleepStyleSupported
 Löwenstein / DeVilbissPartial
 React Health Luna G3Waitlist
 Transcend MicroWaitlist
 Full face masksFit, leak signature, Mask Analytics
 Nasal masksOver-nose and cradle styles
 Nasal pillowsMinimal-contact fit tips
 Wellue O2RingSupported
 Contec CMS50 familySupported
 Apple Health / Health ConnectResting HR, HRV, SpO₂, sleepSupported
 What is AHI?The apnea-hypopnea index, explained
 What is a good AHI on CPAP?
 CPAP leak rate explained
 Pressure settings explained
 Reading CPAP waveformsAll 14 explainers
 Apnealytics vs SleepHQ
 Apnealytics vs OSCAR
 Apnealytics vs myAir
 Apnealytics vs DreamMapper
 SleepHQ vs OSCARBest CPAP apps in 2026
 How to read CPAP dataStart here: six numbers, in order
 Read your CPAP SD card
 Share data with your doctorChoosing a CPAP mask
 Travel with CPAPAll guides
 Mask finderSeven questions, a ranked mask typeYour data
 Machine finderA two-machine shortlist for your prescription
 iPhone / iPhone DuoLast night before you are out of bed. Apple Health vitals, Face ID.Live
 iPadSame universal app, side-by-side panes and full-width waveforms.Live
 AndroidPhones, tablets and foldables, with Health Connect built in.Live
 Web portalWhere your SD card goes. Every chart, report and setting.Live

