


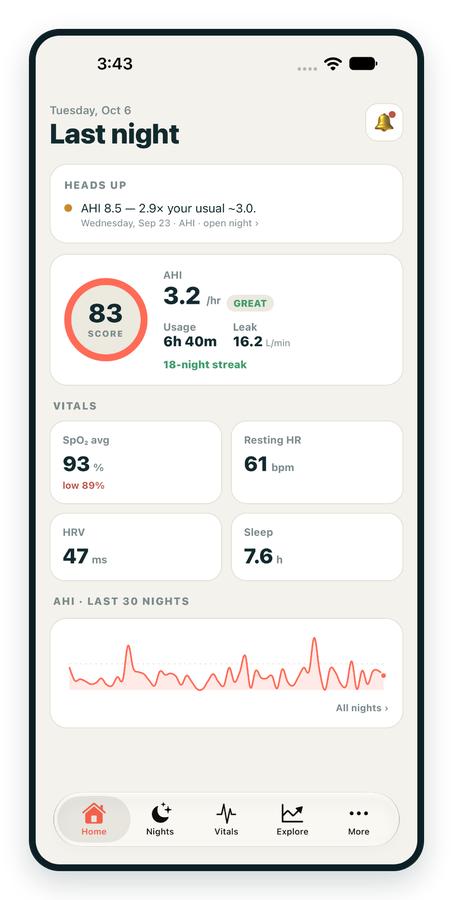
iPhone / iPhone Duo Live
Last night before you are out of bed. Apple Health vitals, Face ID.
Download on the App Store Apnealytics
Free on every plan: unlimited imports, the full dashboard and your last 30 nights.
 Compatibility checkerWill my machine work?Type your model. You get a straight answer: supported, partial, waitlist, or why not.Check my machine
 If it writes an SD card, we probably read it. ResMed AirMini has no card, so no app can read it.
Sleep Check-up
3 of 6 checks done
Six short screeners, one picture of how you sleep. Earn a milestone for each, save results and get retake reminders.
Latest milestone: Sleepiness check done
 NEWTrack your 90-day compliance windowOpen the calculator
 13 free tools. No account needed — sign in to save results and fill answers from your own CPAP data.
Last night before you are out of bed. Apple Health vitals, Face ID.
Download on the App Store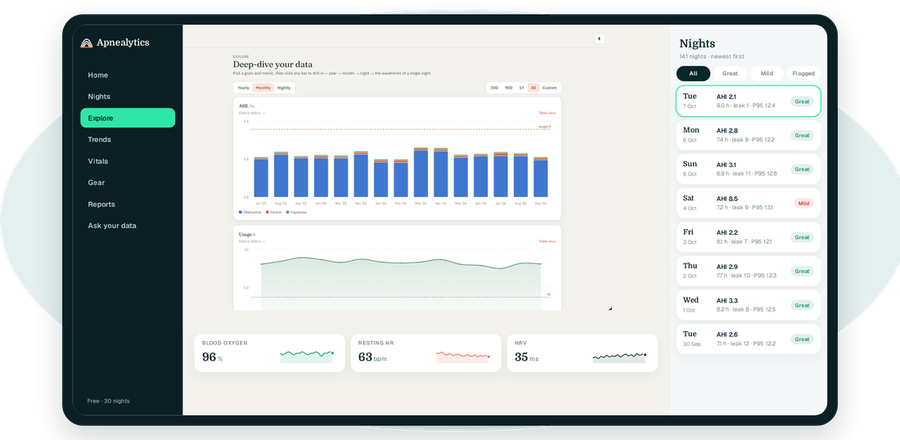
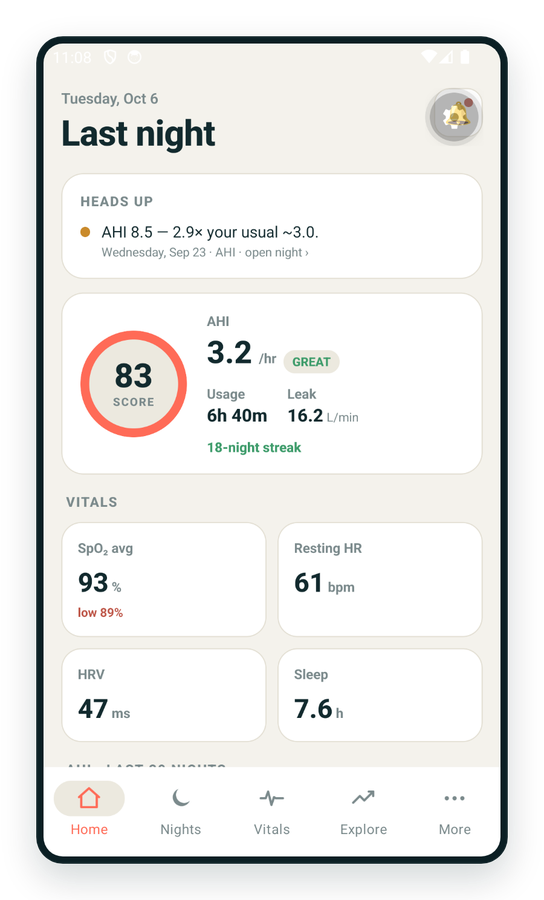
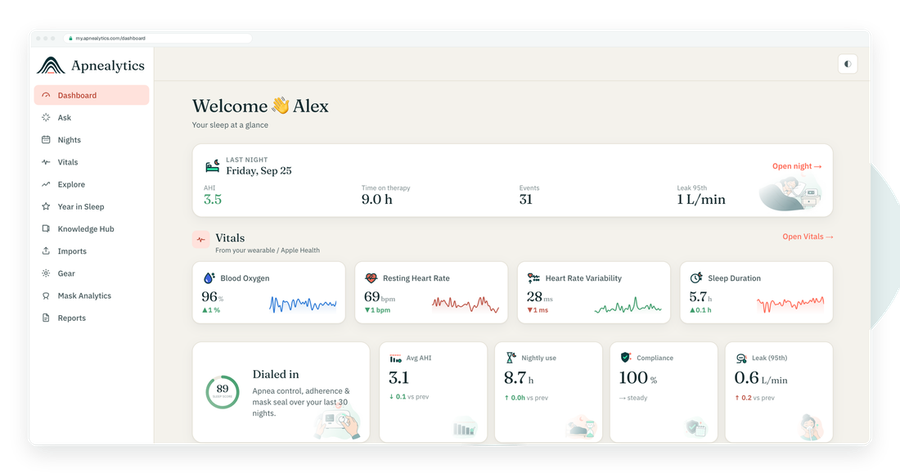
One account on every screen. Apple Watch vitals sync through Apple Health.
Your machine records a lot every night. This is where we explain what each number means, where it comes from, and what is worth raising with your clinician. Evergreen, no jargon, no sales pitch.
Every guide here follows the same shape. It tells you what the metric is, how your ResMed machine measures it, what the widely accepted definitions say, and how it looks inside Apnealytics. Each one ends with a short FAQ and links to the product features and machine pages that touch the same number.
Start with the basics if you are new to therapy. If you have been reading your data for a while, jump to the advanced pages on flow limitation, central events and waveforms. Nothing here is medical advice; the goal is to make your conversation with your clinician sharper, not to replace it.
 BasicsThe vocabulary of therapy. What AHI is, what a good AHI on CPAP looks like, what a hypopnea is and how usage hours turn into the 4-hour/70% compliance rule your insurer may care about.What is AHI?What is a good AHI on CPAP?Hypopnea explainedCPAP usage hours and adherence
 Leak and mask fitLeak is the number most likely to quietly undermine a night. Why the 95th percentile matters more than the average, and how to tell a mask problem from a mouth problem.CPAP leak rate explainedMask fit and leak analyticsMasks that work with Apnealytics
 Pressure and comfortPressure is a range, not a number. What P95 pressure tells you, how auto machines decide where to sit, and what EPR and Flex do on exhale.CPAP pressure settings explainedWhat is P95 pressure?EPR and Flex explainedFlow limitation explained
 EventsNot every event is the same. How a machine tells an obstructive apnea from a central one, and why "unclassified" shows up when leak is high.Central vs obstructive apnea on CPAPHypopnea explainedReading CPAP waveforms
 OxygenYour machine cannot see your blood oxygen. An oximeter can. What SpO₂, ODI and T90 mean beside your therapy data.SpO₂, desaturation, ODI and T90Oxygen overlay in ApnealyticsOximeters that work
 ScoresSingle-number scores are convenient and easy to over-read. What goes into our Sleep Score and ResMed's myAir score, and what neither can show.Sleep Score explainedmyAir score explained
 What is AHI?The one number everyone looks at first. What it counts, why your machine's AHI differs from a sleep lab's, and the severity bands clinicians use.Read →
 CPAP leak rate explainedWhy ResMed reports unintentional leak, what the large-leak threshold is, and how to read leak P95 on your dashboard.Read →
 Reading CPAP waveformsA visual tour of airflow, pressure and leak traces, with the shapes to look for and the ones that are usually noise.Read →
 Central vs obstructive apnea on CPAPHow a machine decides your airway was open or closed during an apnea, and why that distinction matters.Read →
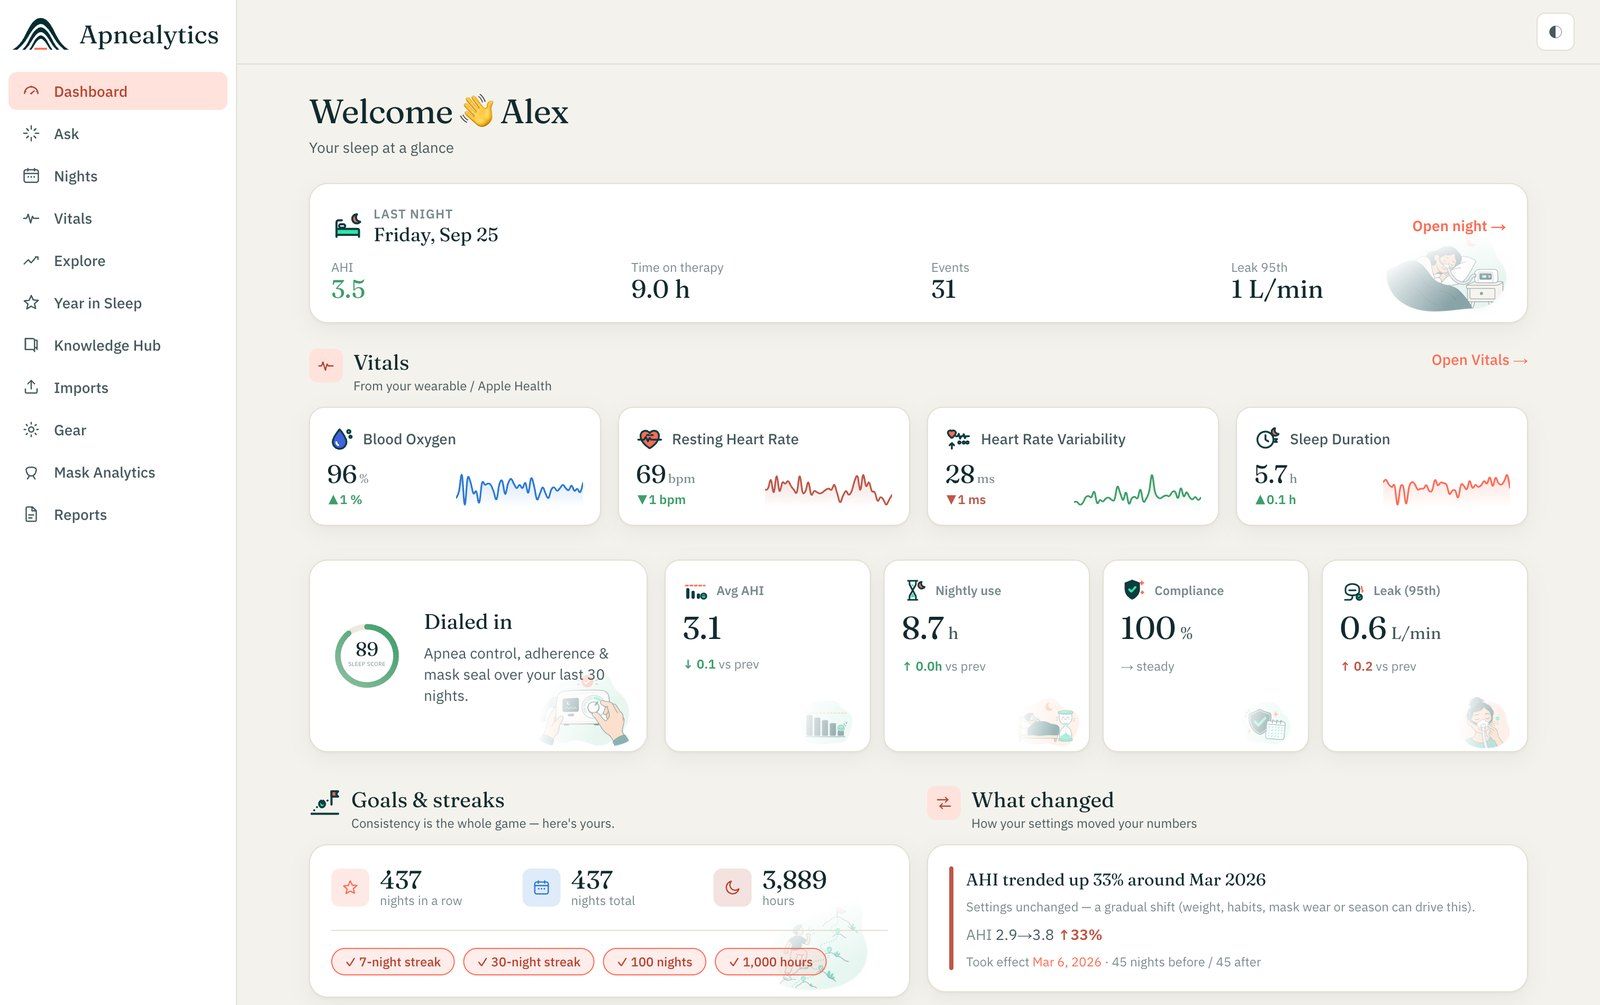
Every metric in these guides maps to somewhere on your dashboard: last-night AHI with its band, usage hours, leak P95, pressure P95 against your set range, EPR, respiratory rate and event composition. Trends shows them over 30 nights, 90 nights, a year or all time. Pro adds the breath-by-breath viewer for the raw traces and the oxygen overlay for oximeter data. All of it starts with your SD card.
A note on sources: severity bands and the hypopnea scoring rule come from the American Academy of Sleep Medicine. The 4-hour/70% adherence rule comes from US Medicare coverage policy, which most private insurers mirror. Device-specific thresholds come from the manufacturer's own documentation. If you spot an error, tell us at info@apnealytics.com.
We publish a new explainer roughly once a month. No health data, no tracking pixels, unsubscribe in one tap.
 DashboardSleep Score, AHI band, leak and pressure
 Trends & historyA year down to a night
 Breath-by-breath viewerAirflow, pressure, leak tracesPro
 SpO₂ overlayOximeter data on the same nightPro
 Pressure insightsP95, set range, EPR and ramp
 SD card importDrop the card folder, only new nights added
 Mask fit & gearWhich mask actually seals
 Ask your dataPlain-English questions, your own AI keyBYOK
 Year in SleepYour therapy year in one storyNew
 Compliance reportFinds the qualifying window for youPro
 Share with your doctorRead-only, revocable links
 Companion appiPhone, iPad and Android
 Privacy & securityYour data, locked to you
 ResMed AirSense 10 & 11Supported
 ResMed AirCurve 10 & 11 VAutoSupported
 ResMed S9 / LumisSupported
 Philips DreamStation 1 & 2Supported
 Fisher & Paykel SleepStyleSupported
 Löwenstein / DeVilbissPartial
 React Health Luna G3Waitlist
 Transcend MicroWaitlist
 Full face masksFit, leak signature, Mask Analytics
 Nasal masksOver-nose and cradle styles
 Nasal pillowsMinimal-contact fit tips
 Wellue O2RingSupported
 Contec CMS50 familySupported
 Apple Health / Health ConnectResting HR, HRV, SpO₂, sleepSupported
 What is AHI?The apnea-hypopnea index, explained
 What is a good AHI on CPAP?
 CPAP leak rate explained
 Pressure settings explained
 Reading CPAP waveformsAll 14 explainers
 Apnealytics vs SleepHQ
 Apnealytics vs OSCAR
 Apnealytics vs myAir
 Apnealytics vs DreamMapper
 SleepHQ vs OSCARBest CPAP apps in 2026
 How to read CPAP dataStart here: six numbers, in order
 Read your CPAP SD card
 Share data with your doctorChoosing a CPAP mask
 Travel with CPAPAll guides
 Mask finderSeven questions, a ranked mask typeYour data
 Machine finderA two-machine shortlist for your prescription
 iPhone / iPhone DuoLast night before you are out of bed. Apple Health vitals, Face ID.Live
 iPadSame universal app, side-by-side panes and full-width waveforms.Live
 AndroidPhones, tablets and foldables, with Health Connect built in.Live
 Web portalWhere your SD card goes. Every chart, report and setting.Live

